Appearance
Console Guide
Arus Console is a single-page application built with vanilla HTML, CSS, and JavaScript — no build tools, no npm, no framework weight. It runs behind nginx and communicates with the Arus API via REST.
Pages Overview
| Route | Page | Access |
|---|---|---|
#login | Login | Public |
#dashboard | Dashboard | All authenticated users |
#sources | Sources | All authenticated users |
#destinations | Destinations | All authenticated users |
#pipelines | Pipelines | All authenticated users |
#pipeline/:id | Pipeline Detail | All authenticated users |
#runs | Run History | All authenticated users |
#dag | DAG View | All authenticated users |
#notifications | Notifications | All authenticated users |
#users | Users | Admin only |
#settings | Settings | Admin only |
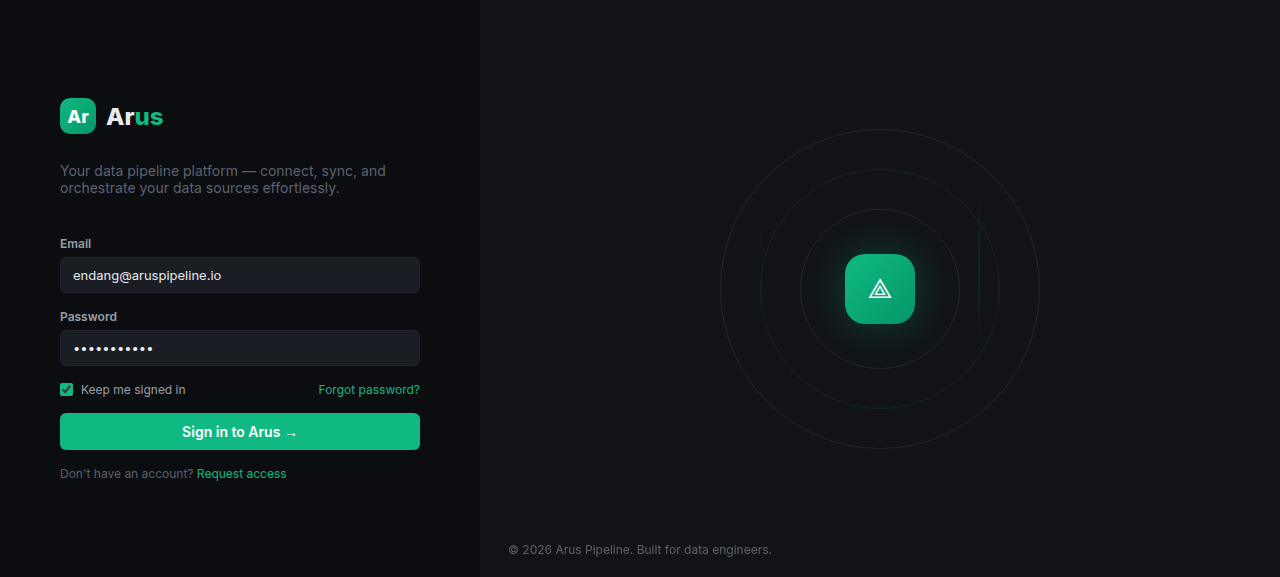
Login Page
Two-column layout with the login form on the left and Arus branding on the right.
Features:
- Email + password authentication
- "Keep me signed in" toggle (persists refresh token)
- Forgot password link
- Rate-limited (10 attempts per 60 seconds per IP)
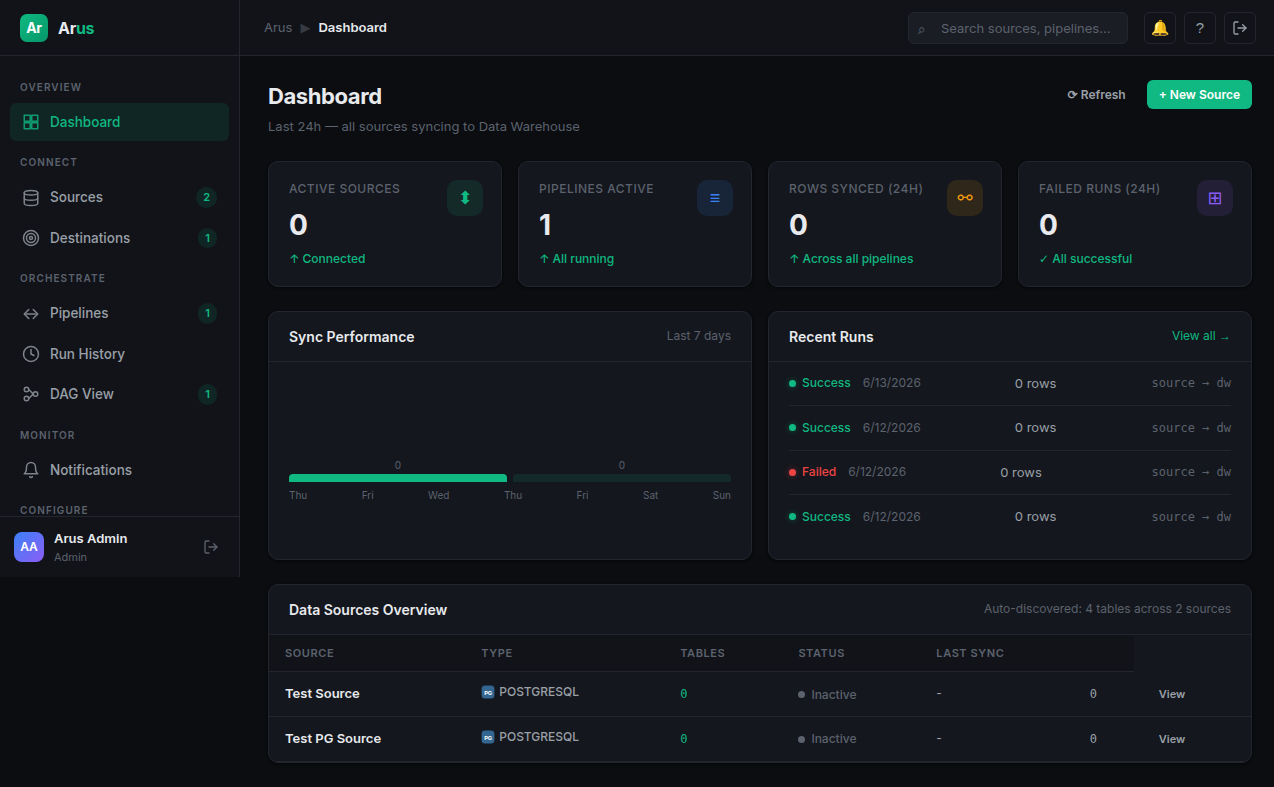
Dashboard
The main landing page after login. Provides a high-level overview of pipeline health.
Stat Cards
| Card | Description |
|---|---|
| Active Sources | Total configured source connections |
| Pipelines Active | Currently running or scheduled pipelines |
| Rows Synced (24h) | Total rows synced in the last 24 hours |
| Failed Runs (24h) | Failed pipeline runs in the last 24 hours |
Sync Performance Chart
Bar chart showing daily rows synced over the last 7 days. Data from GET /api/runs/stats/daily?days=7.
Recent Runs Feed
Last 5 pipeline runs with status, duration, and links to pipeline detail.
Data Sources Overview
Table showing all configured sources with:
- Source name and type icon (PG/MySQL/MariaDB/MongoDB)
- Host:port
- Total tables discovered
- Connection status (Connected/Error)
- Last sync timestamp
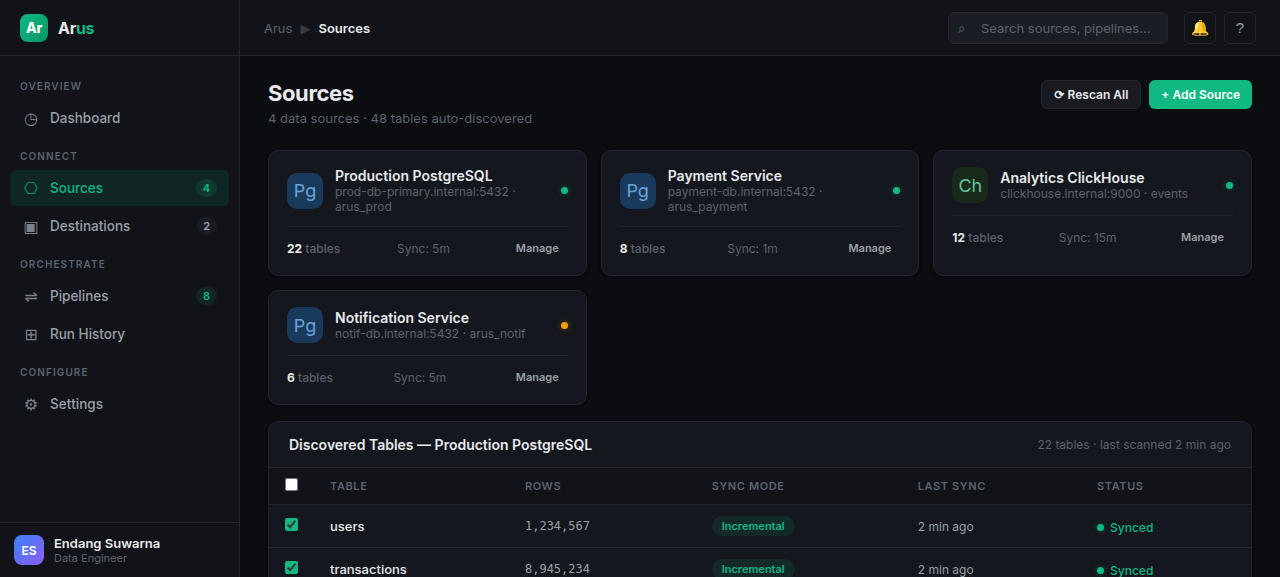
Sources Page
Manage source database connections and auto-discover tables.
Source Cards
Each source is displayed as a card showing:
- Database type icon (color-coded: PostgreSQL blue, MySQL teal, etc.)
- Connection details (host, port, database)
- Status dot (green = connected, red = error)
- Table count
- Sync interval
Actions
| Action | Description |
|---|---|
| Add Source | Opens modal to configure a new source connection |
| Rescan | Re-discover tables and columns from the source |
| Rescan All | Re-discover all sources |
| Edit | Open source configuration modal |
| Test Connection | Verify source connectivity |
| Delete | Remove source (with confirmation) |
Add Source Modal
Dynamic form that changes based on selected source type:
MySQL / MariaDB / PostgreSQL:
- Name, Host, Port, Database, Username, Password
- SSL toggle
- Sync Method (Auto-detect, Incremental, Full Refresh)
- Schema filter (PostgreSQL only)
- Table include/exclude glob patterns (e.g.,
+orders*,-audit_*)
MongoDB:
- Name, URI (connection string)
- Or: Host, Port, Database, Username, Password, Auth Source
- SSL toggle
Table Discovery
After adding/rescanning a source, tables are displayed with:
- Table name
- Row count estimate
- Detected sync mode tag (Incremental / Full Refresh)
- Load mode selector (Direct / Raw → Normalize)
- Enable/disable checkbox
- Save Table Selection button (auto-creates or updates the pipeline)
Destinations Page
Manage data warehouse connections.
Destination Cards
Each destination card shows:
- Type icon
- Connection details
- Raw schema and target schema names
- Default badge
- Status
Actions
| Action | Description |
|---|---|
| Add Destination | Configure new destination (PostgreSQL, MySQL, ClickHouse) |
| Edit | Update destination configuration |
| Test Connection | Verify destination connectivity |
| Delete | Remove destination (with confirmation) |
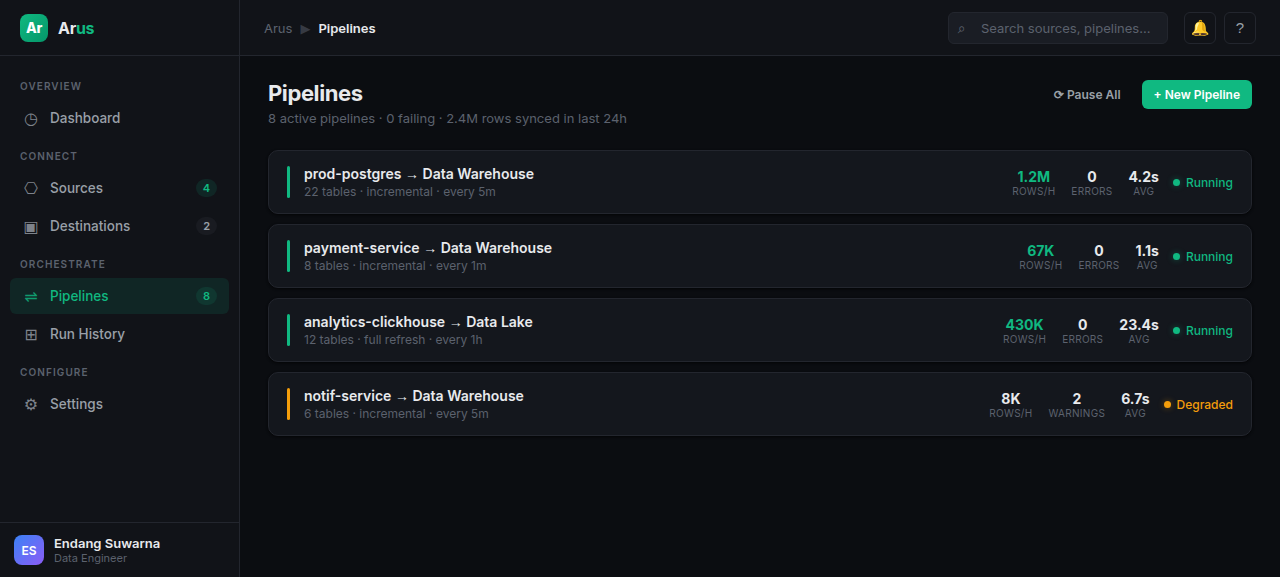
Pipelines Page
View and manage all ETL pipelines.
Pipeline Cards
Each pipeline card shows:
- Status indicator (green = running, amber = degraded/paused, gray = inactive)
- Pipeline name
- Source → Destination summary
- Throughput (rows/hour)
- Error count
- Average latency
- Table count
- Sync type
- Schedule
- Target schema
- Load mode
Actions
| Action | Description |
|---|---|
| Add Pipeline | Create new pipeline with source, destination, tables |
| Pause All | Pause all active pipelines |
| Resume All | Resume all paused pipelines |
Add Pipeline Modal
- Source selector (dropdown of configured sources)
- Destination selector (dropdown of configured destinations)
- Sync mode (Incremental / Full Refresh)
- Schedule presets (5 min, 15 min, hourly, 6h, daily, weekly, manual)
- Target schema
- Load mode (Direct / Raw)
- Optional notification linking
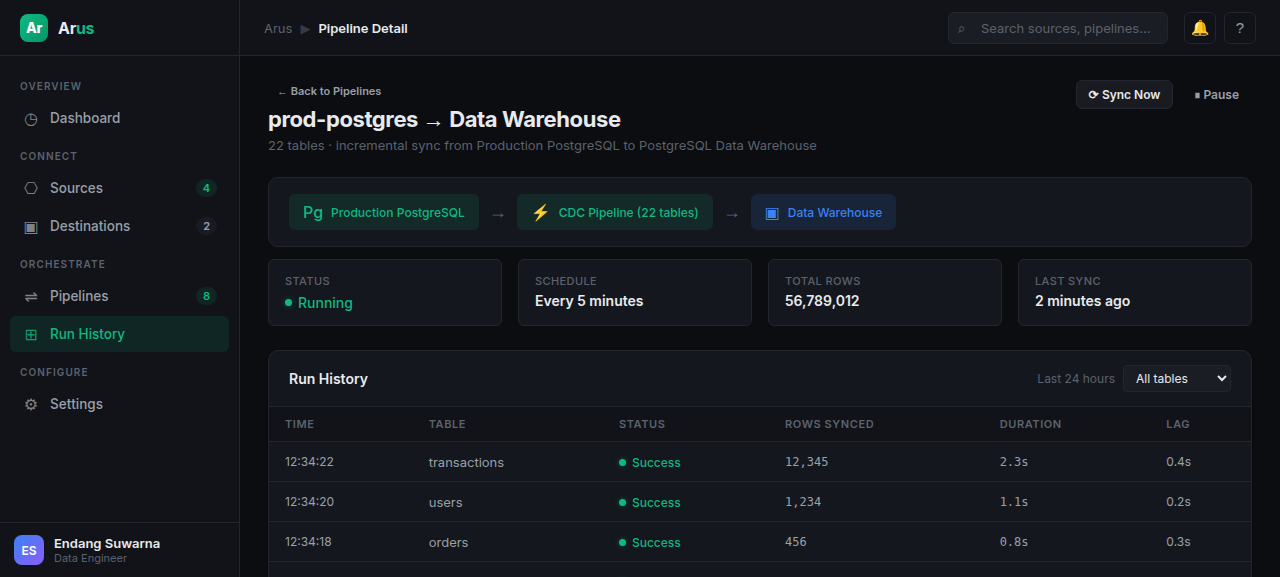
Pipeline Detail Page
Deep-dive into a single pipeline's configuration, runs, and data.
Flow Diagram
Visual representation:
[Source DB] ──→ [CDC Pipeline] ──→ [Destination]Meta Cards
| Card | Content |
|---|---|
| Status | Running / Degraded / Paused / Inactive |
| Schedule | Cron expression (editable) |
| Total Rows | Lifetime rows synced |
| Last Sync | Timestamp of most recent run |
Actions Bar
| Button | Description |
|---|---|
| Sync Now | Trigger immediate run |
| Pause / Resume | Toggle schedule |
| Dropdown Menu | Full Refresh, Backfill, Dead Letters, Notifications, Edit Config, Delete |
Tables List
Each table in the pipeline shows:
- Table name
- Target schema
- Sync mode (Incremental / Full Refresh)
- Load mode (Direct / Raw)
- Transform button (configure inline transform steps)
- Watermark column and current value
- Last run status
Run History Table
- Paginated table with columns: Time, Status, Duration, Trigger, Error
- Actions per run: Logs (view log entries), Cancel (if running), Retry (if failed)
Transform Configuration
Inline modal for configuring transform steps:
- Step types: Rename Fields, Remove Fields, Compute Field, Filter Rows, Map Values, Type Cast, Concat Fields, Python Script
- Each step type has its own form
- Reorderable steps (up/down arrows)
- Script management (create/edit/delete Python scripts)
Modals
| Modal | Description |
|---|---|
| Run Logs | Timestamped log lines with level (INFO/WARN/ERROR) |
| Full Refresh | Confirmation dialog with warning |
| Backfill | Date picker for backfill start date |
| Dead Letters | Paginated failed rows with error details |
| Edit Schedule | Cron input with presets |
| Edit Config | Name, target schema, load mode |
| Notifications | Link/unlink notification targets |
Run History Page
Global view of all pipeline runs across all pipelines.
Features
- Paginated table (20 runs per page) with Previous/Next controls
- Status filter: All / Success / Failed / Running
- Columns: Time, Pipeline name (clickable), Status, Duration, Rows, Trigger (scheduled/manual), Actions
- Actions: Logs, Cancel (if running), Retry (if failed)
- Refresh button
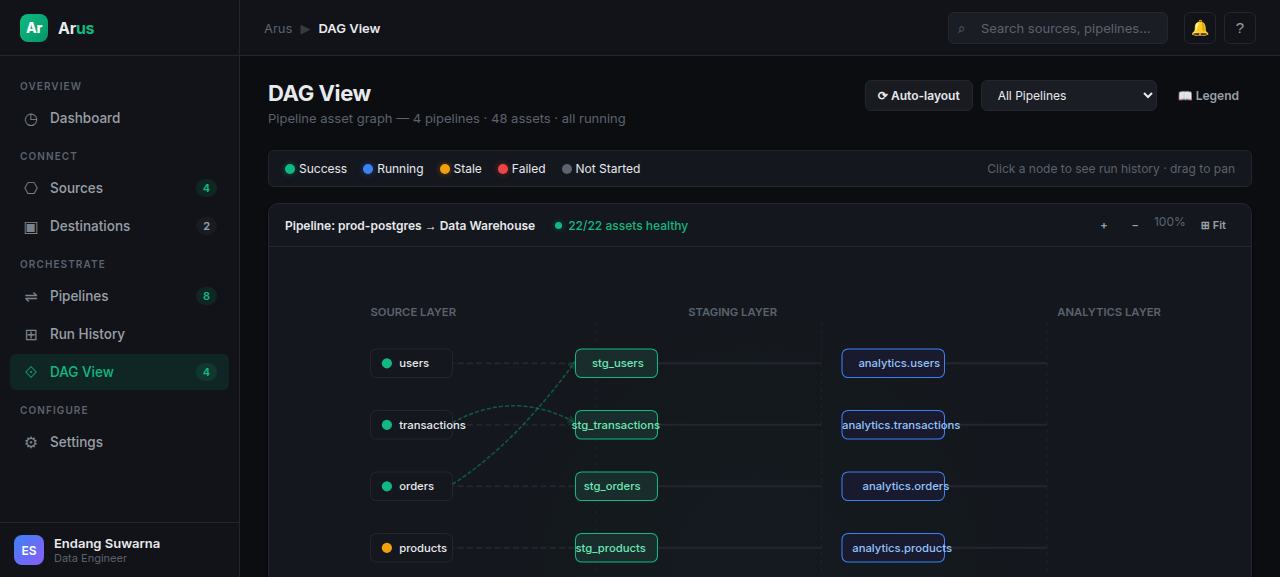
DAG View
Interactive SVG-based asset graph showing the three-layer pipeline architecture.
Layers
┌─────────────────────────────────────────────────────┐
│  SOURCE LAYER  │  RAW LAYER  │  TARGET LAYER       │
│                  (if raw mode)                       │
│                                                     │
│  users ────────── stg_users ──────── analytics.users │
│  orders ───────── stg_orders ─────── analytics.orders│
│  products ─────── stg_products ───── analytics.prod  │
└─────────────────────────────────────────────────────┘
Features
- Zoom/Pan: Mouse drag to pan, +/- buttons to zoom, Fit button to reset
- Color-coded nodes:
- 🟢 Green = Success
- 🔵 Blue = Running
- 🟠 Amber = Stale (no recent runs)
- 🔴 Red = Failed
- ⚪ Gray = Not started
- Bezier curve edges between connected nodes
- Click node: Opens detail panel with:
- Asset name and status badge
- Layer info
- Upstream/downstream dependencies
- Recent runs table
- Pipeline selector: Dropdown to switch between all pipelines or a specific one
- Legend: Toggle legend visibility
Users Page (Admin Only)
Manage Arus user accounts.
User Table
- Name (with avatar initial)
- Role tag (Admin / Editor / Viewer)
- Status (Active / Disabled)
- Last login timestamp
- Actions (Edit, Delete)
Summary Stats
- Total users count
- Active users count
- Admin count
- Editor count
Add/Edit User Modal
- Name, Email, Password
- Role selector (Viewer / Editor / Admin)
- Active toggle
- Validation: email format, required fields
Delete User
- Confirmation modal
- Cannot delete your own account (admin protection)
Settings Page (Admin Only)
Manage global Arus runtime settings.
General Section
| Setting | Type | Default |
|---|---|---|
| Pipeline name prefix | Text | arus-prod- |
| Default sync interval | Cron select | */5 * * * * |
| Auto-discover tables | Toggle | Enabled |
| Schema drift detection | Toggle | Enabled |
| Auto-alter schema | Toggle | Disabled |
Quality & Retry Section
| Setting | Type | Default |
|---|---|---|
| Max retries | Number | 3 |
| Initial backoff (s) | Number | 2 |
| Quality check threshold (%) | Number | 5.0 |
Notifications Section
| Setting | Type | Default |
|---|---|---|
| Pipeline failures | Toggle | Enabled |
| Schema drift | Toggle | Enabled |
| Dead letter rows | Toggle | Enabled |
Save
Changes are persisted immediately to arus_config.runtime_settings.
Notifications Page
Manage notification targets and pipeline-notification links.
Targets Table
- Name
- Type icon (Telegram / Discord / Slack)
- Status (Active / Disabled)
- Created date
- Actions: Edit, Test, Delete
Add/Edit Target Modal
- Name
- Type selector with dynamic form:
- Telegram: Bot Token + Chat ID
- Discord: Webhook URL
- Slack: Webhook URL
- Active toggle
- Secrets can be left blank when editing (keeps existing value)
Test Button
Send a test notification with selectable event type:
- Default Test, Success, Failure, Dead Letter, Schema Drift, Quality Breach
Pipeline Linking
When viewing a pipeline detail's notifications, you can:
- View linked targets with event types
- Link a new target: select from active targets, choose events
- Edit/Delete existing links
- Warning when no targets configured
Design System
| Element | Value |
|---|---|
| Theme | Dark mode — deep black (#0b0d11) with golden yellow accents (#eab308) |
| Typography | Inter, system sans-serif |
| Layout | Fixed sidebar (240px) + scrollable content |
| Border Radius | Cards: 10px, Buttons/Inputs: 6px |
| Status Colors | Emerald (success), Blue (running), Amber (stale/warning), Red (failed), Gray (disabled) |
Sidebar Navigation
Overview
├── Dashboard
Connect
├── Sources
├── Destinations
Orchestrate
├── Pipelines
├── Run History
├── DAG View
Monitor
├── Notifications
Configure (admin only)
├── Users
├── Settings